A crore-rupee machine goes down; nobody notices for an hour. A quality problem starts today, surfaces next week. By then the money is gone.
EdgeBits reads the meters and PLCs you already own, ranks what each loss is costing you, and records the fix. Your data stays on your server, and publishes to SAP, Oracle, or Tally.
Year one, typically: 25–35% less unplanned downtime, 5–10% off the energy bill. Industry figures, sourced. Put your own numbers in.
START WHERE YOU SIT
Most plants are stuck at step one. The money is in steps two and three.
Reads the meters, PLCs, CNCs and sensors already bolted to your floor, over the protocols they already speak. Nothing gets replaced, no rewiring, no production stop.
Proof: seven protocols in the catalog: Modbus, OPC-UA, Siemens S7, EtherNet/IP, MQTT, REST and IEC 60870-5-104. Runs on a ₹5,000 box. Need one that isn’t listed? It ships as an add-on block, not a platform rewrite.
Not another dashboard to read. You get a ranked list of where money is leaking, each line with the reason attached: which machine, which shift, what changed just before it started.
Proof: every figure is computed by the platform, never written by a language model. You can trace any number back to the readings behind it.
Alerts to the people who can act, setpoints back to the machine, production actuals into your ERP. Every change is stamped with who did it, when, and why, and can be reversed.
Proof: a tamper-evident record you can export whole and hand to an auditor, a customer, or a regulator.
Running a TPM program? See how this maps to the Six Big Losses. You can also ask your plant questions in plain English.
One production line. Thirty days. Your meters, your server, your numbers — and at the end, a figure you can check against your own books rather than a slide we made.
We read the machines already on that line, over the protocols they already speak. Nothing is rewired, nothing is replaced, and production does not stop for us.
Live view of that line, the losses ranked by what they cost, with the reason attached to each one. This is usually the week somebody says “I did not know it was doing that.”
What the line actually cost you over the month and what is recoverable, next to the estimate you started with. If the two do not agree, we would rather you find out on one line than on ten.
Fixed-fee, and it comes off the licence if you go ahead. You keep the data either way, because it never leaves your server. Tell us which line you would put it on, or estimate the number yourself first.
Getting from a machine to a decision usually means buying an edge data layer from one vendor, a historian from another, and an intelligence tool from a third, then paying somebody to make the three of them talk. Two of those vendors will keep your data on their cloud.
Reads your machines where they stand, processes at source, and survives the network you actually have. Outbound-only, so plant IT never opens a port.
Three years of history on your own box: raw for 90 days, then rolled up. No per-tag tax, so adding a line is not a licence negotiation.
Losses ranked by what they cost, the reason attached, the fix recorded. The part the other two leave to you, and the part that normally means shipping your plant data into somebody else’s tenancy.
One platform, edge to last mile, on infrastructure you choose: the plant floor, your private cloud, or hosted by us. Already run a historian? Keep it; we publish into AVEVA PI and reach Ignition over Sparkplug B. How it deploys.
Not another dashboard to interpret. A map where each line is sized by what it costs you and coloured by how bad it is, then the reason, the fix, and proof it worked.
Every line drawn in proportion to the money leaking through it. Red where it hurts, green where it does not. One look tells you where to spend Monday: power, water, compressed air, scrap and throughput — on one map instead of five dashboards.
Each loss carries what you actually used, what you should have used, and the gap between them in your own currency. Plus the reason, the evidence behind it, and correlations the platform found on its own. Every figure is computed, never written by a language model.
A recommended next step written for that loss on that line, not a boilerplate tip. Open it as a job, and the platform captures what it was costing before, follows it while the floor works on it, and measures what you got back. Next month you can show the fix held instead of arguing about it.
Underneath, that map is a contextualised knowledge graph of your operation: site, line, device, and what each one is costing. It is built from your own readings rather than a modelling project, and it deepens the longer it runs. There is a full-screen version for the floor too — the OEE kiosk runs on a wall-mounted TV, needs no login, and an operator can retune what it shows without calling anyone. Part of the Analytics add-on. Then it keeps score, by day, week, month, quarter and year, normalised per unit produced so a busy month cannot flatter you. When there is no tariff for a meter the loss is shown in units and the money is marked unknown, because an honest gap beats a confident zero. Ask it questions in plain English.
A plant generates facts by the million. Most alarm systems turn those into thousands of notifications a day, which is how operators learn to ignore them. The job is not more alerts. It is fewer, each one real.
Every value from every machine, kept and queryable. Facts, not judgements. Nobody is meant to read these.
A condition you set was met, with severity and context attached. Useful, but on their own this is where alarm fatigue comes from.
Related alerts correlated into one episode that has a state and an owner: open, being worked, resolved. Six alarms from one failing pump are one incident, not six interruptions. This is the list a shift lead can actually work through.
Aligned with ISA‑18.2, the alarm-management standard your process engineers already work to — so the shape is one they recognise rather than one we invented.
Ask in the words you would use in a shift meeting, and get the answer with its working attached — the readings, the window, what changed. The hard part was never the asking. It is defending the answer in the room afterwards.
Every figure comes from the platform doing the arithmetic on your readings. The model narrates; it never invents the number. One report you can sign. The other you cannot.
Ask it to open a job on the worst loss and it does — under the same permissions as a person, on the same audit trail. An assistant that can only talk is a search box with better manners.
Hosted for speed, or running on your own hardware so nothing leaves the site. Swap it later and nothing else changes — no rebuild, and no lock-in to one AI vendor.
Everyone asks in their own words and sees only their own scope — an owner across every plant, a manager on theirs, an operator on their line. See how asking works.
Reads from the equipment you already own
Sends it wherever you need it
Built on published standards your IT team already knows: ISA-95, MQTT, OPC-UA. Nothing here is proprietary. Audit + correlation via fasten (GitHub), our open-source audit trail. Every state change is auditable and immutable: who did what, when, where, why, and how. New blocks ship on demand, not as a platform rewrite. No proprietary protocols, no vendor lock-in.
Data queues locally at the edge, encrypted. Syncs automatically on recovery. Nothing lost, no manual intervention, no data gaps in your reports.
Processing happens at the source. Only refined, approved data leaves your network. Your sensors never talk to the cloud directly. You control what moves and when.
Rules, aggregations, FFT, and alerts all run on the edge node. Cloud gets answers, not noise. Less bandwidth, faster response, lower cost.
Most plant software is worth the same on day 400 as it was on day one. This is built the other way.
Each machine carries a live model of itself — a digital twin: its state, its history, how much life is left in the part that is wearing. Each line carries the same for a whole order: what it produced, at what quality, for what energy. It does not only map your machines and what they cost. It accumulates. What went wrong on this line before, what fixed it, what that fix was worth, what changed since. A plant you have run for a year is easier to run than one switched on last week, because the system knows the difference.
Reconcile against SAP or the ERP you already run — production orders, cost centres, quality specs. The money stops being per line and becomes cost per order, per SKU, per customer. That is the number your finance director will argue with you about.
Models run on the box itself rather than a cloud round trip — bearing wear, motor-current drift, the slow slide before a stoppage. Predictive maintenance on hardware you already own, with nothing leaving the plant to get it.
Historian integrations for FactoryTalk and Wonderware, native SAP RFC/BAPI, and alert-to-incident correlation round it out. Tell us what your stack looks like and we will show you the parts that matter to you.
The engineers building EdgeBits have spent 7+ years shipping industrial IoT software: contributing to open-source projects, building OT protocol integrations, and deploying systems in real factory environments. Deep familiarity with what actually breaks on the shop floor.
Bridges Modbus, OPC-UA, EtherNet/IP, S7, Sparkplug B on the OT side to SAP RFC/OData, REST, MQTT, and warehouses on the IT side. Works with ABB, Schneider Electric, Siemens, and Allen-Bradley equipment out of the box. No custom integration projects.
The same engine costs power, water, compressed air, scrap and throughput. Energy is where most plants start, not a separate product — so the second thing you meter needs no new licence and no new tool.
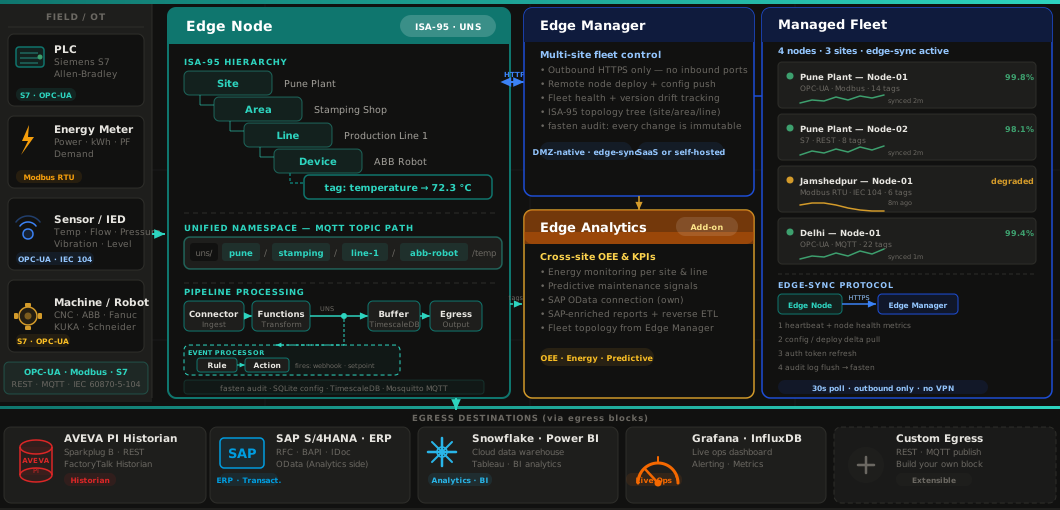
One platform, packaged as three independently deployable parts: the runtime on the floor, the layer that governs the fleet (the control plane), and the layer the answers are computed from (the data plane).
Each can be deployed and sold independently. Start with Edge Node, add Manager and Analytics as you scale.
the edge runtime — any machine, on-prem, no VPN
Factory Floor · Per-Node Licensefleet, topology and deployment across sites — the control plane
Run the fleet Cloud or On-Prem · SaaSOEE, energy, history and the answers on top — the data plane
Reports & history Cloud or On-Prem · Add-OnWhich one you start with depends on what hurts — see them against a real line, or read how they deploy on your network.
Deploy a change to every site from one place, and see which plant needs attention without logging into any of them. Each plant calls out to reach the fleet, so adding the tenth site is the same work as the first.
STOP RENTING YOUR OWN DATA
Meter vendors, historian vendors, MES-as-a-service — they all end up in the same place. Your data on their server, their dashboard, their schema, and a bill every month for the privilege of looking at what your own machines produced.
Modbus TCP/RTU · Siemens S7 · OPC-UA · MQTT · REST connections, on-node storage on TimescaleDB, REST egress — all shipping today, packaged for Debian / RPM. Bring your meter, we’ll bring the box.
Four common shapes below — the ones we hear on the first call. ERP integration, predictive maintenance, and brownfield connectivity each get their own landing on the Solutions page.
Own your energy data. Read from any Modbus meter you already have, keep the readings on your infrastructure.
Meters → Your Server → ReportsOEE, cycle analysis, downtime classification, read directly from PLCs and CNC machines. Live per line.
PLC → Edge → DashboardContinuous monitoring for GMP environments. Immutable audit trails for pharma, food, and auto.
Sensors → Validate → AuditOne plant to ten without VPN. Edge Manager runs the fleet; each plant calls out over HTTPS, so nothing calls in.
N Plants → Manager → One DashboardERP integration, predictive maintenance, and brownfield connectivity each have their own landing.
Shop floor to ERP. One platform, any deployment model.
If your equipment has a network port, there is almost certainly a connector for it — and a new one ships as an add-on, not a platform upgrade. See the full list.
Drag and drop to build a flow: read a machine, shape the reading, send it on. No code. Works on any device with a browser.
Behind corporate DMZ, on air-gapped intranet, or in Docker/K8s. Adapts to your IT policy, not the other way around.
Edge node buffers locally through network drops and power cuts. When the link returns, missing windows backfill into their correct slot. The daily roll-up has no holes.
Remote-deploy pipelines, push config and watch health across every site, with no VPN to any of them. SaaS or self-hosted.
OEE per line, tag explorer, data quality monitor. Correlate with your ERP (SAP, Oracle, Tally, ERPNext): production orders, cost centers, quality specs. No must-have for inbound access to the plant.
Every state change is sealed by fasten, our open-source audit trail: who did what, when, where, why, and how. Tamper-evident hash chain, exportable for any audit, immutable by design.
Push production actuals to SAP (MES/ERP) via RFC/OData, Oracle/Dynamics via REST, or legacy ERPs via batch reports. Close the shop-floor-to-MES/ERP gap in real time.
Every machine on every site is named in one consistent structure: plant, area, line, machine, reading. It sounds like bookkeeping. It is the difference between comparing two plants on Monday morning and commissioning a six-week mapping project first.
It also means a new tool just reads. Point Power BI at it, or a historian, or an AI assistant, and none of them need anything rewired on the floor or changed in the PLC. The structure is ISA-95, published and vendor-neutral, carried on a Unified Namespace. There is nothing proprietary to learn, and nothing that locks your data to us.
Everything the platform can read, shape, decide and publish is a building block in one versioned library. Need a protocol or a destination that isn’t there yet? It arrives as a new block on a running system — nobody re-platforms, nobody re-tests the plant. That is how it is built, not a promise for a future release.
New blocks publish continuously, and what gets built next follows what customers actually ask for. If a specific connector or destination is on your critical path, tell us and we will sequence it.
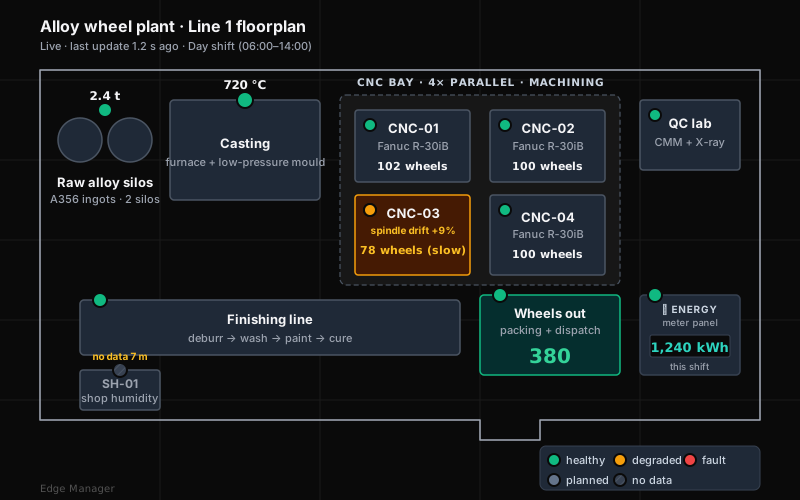
Anyone who has run Wonderware, FactoryTalk View or Ignition Perspective expects a screen where each machine is a shape whose colour tells you whether to walk over. You get the same thing here, driven by live readings instead of a separate HMI project. Plant managers read pictures, not tables. The spatial view lays every machine on your shop-floor plan with a live health pin (green / amber / red), driven by the same live readings everything else on the platform reads from. Hover for the why, click for live values + history.
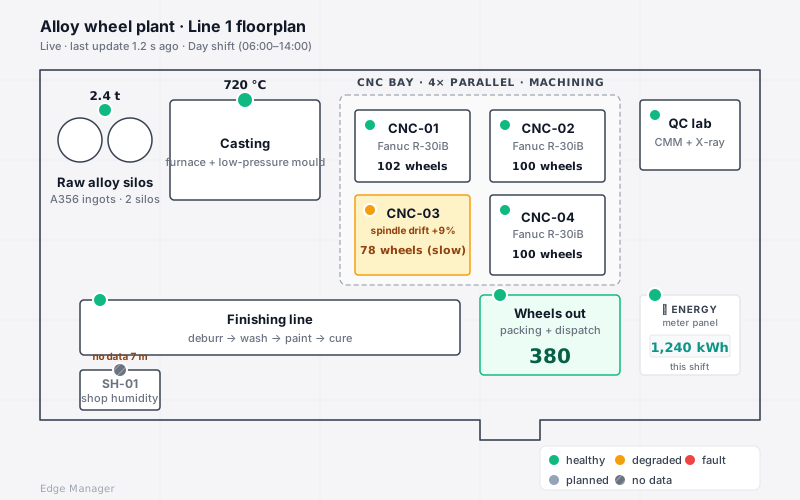
Three views ship together: Floorplan (where on the line is the red light), Data Wall (a kiosk-friendly tile gallery of every machine), Device Detail (make, model, photo, location, last 24 h). All driven by the topology you already have. Tell us which line you'd put it on first.
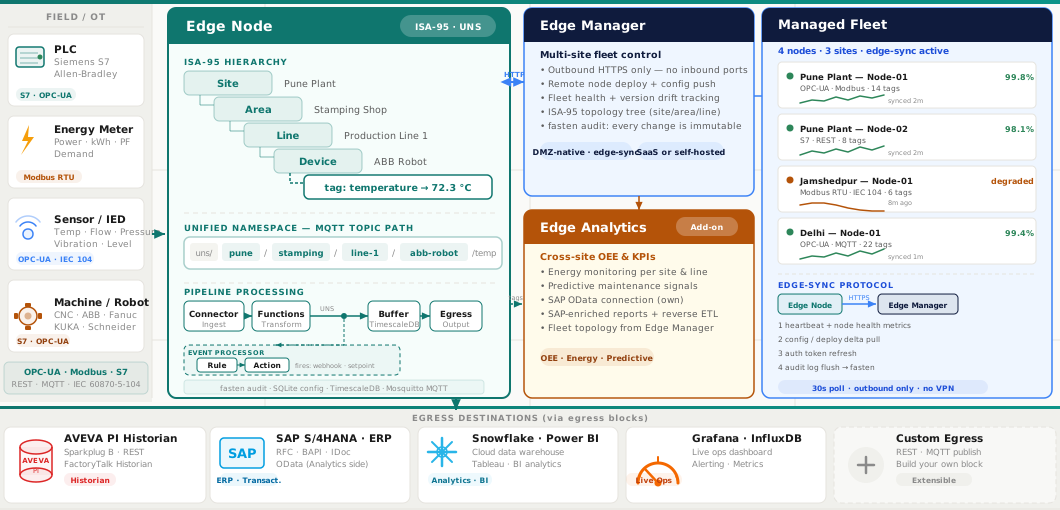
Nothing calls into your plant. No inbound port, no VPN concentrator, no agent phoning home on its own schedule — and air-gapped is a supported configuration rather than a workaround.
Mutual TLS, data residency, roles and audit, the protocol list, how it installs: all of it is answered on the page written for them. Send us your security questionnaire and we will fill it in.
Connect a meter on Friday, show a live dashboard on Monday. The first one takes an afternoon; the rest is you deciding what else to point it at.
Deploy on bare-metal Linux, in Docker, or on Kubernetes. Enter a one-time claim code, and the device registers itself via outbound HTTPS. No firewall changes, no IT escalation.
Your IT installs it once. You manage everything from a browser.
Open the dashboard and drag the steps onto a canvas: read, shape, send. Configure each node with auto-generated forms — validation, hints, and dependency checks built in.
Each site checks in with Edge Manager continuously. Push deployments, pull health and readings, manage settings — all through Edge Manager. A secure on-demand session for live troubleshooting when you need it.
Your meter has a Modbus port. You don't need the vendor's cloud. Honest math on what it costs to own your own numbers.
Read ArticleA deadline, not a dashboard. What we shipped for CCTS: Modbus meter to sealed tCO₂e/t on the box, three deploy variants, audit-ready lineage.
Read ArticleVendors quote 90% savings. The real year-1 number is 1.4% of revenue. Honest math with the citations open.
Read ArticleOwner, plant manager, operator: each asks the same assistant in the words they already use, and gets scoped answers with the audit trail attached.
Read ArticleISA-95 as a runtime, OPC UA as a feeder, and one MQTT bus on the edge that feeds MES, ERP, historian, BI, and AI. No point-to-point spaghetti.
Read ArticleIndian manufacturing is at an inflection point. Factories have PLCs and SCADA, but the data stays trapped on the shop floor.
Read ArticleTag discovery, on-site processing, publishing to the cloud, and remote monitoring. Four steps from PLC register to live dashboard.
Read Article90% less cloud bandwidth, zero VPN licenses, offline resilience, and faster SAP integration. The ROI case for edge.
Read Article4.0 connected the machine. 5.0 connects the human. Here's how your edge infrastructure evolves without ripping and replacing.
Read ArticleSAP wants real-time data. The plant manager won't open firewall ports. Here's the architecture that satisfies both.
Read ArticleYour factory has legacy PLCs and manual data entry. Here's how to turn it into a connected operation without ripping anything out.
Read ArticleReferences come out under NDA in a demo, not on a web page. The people building it are not anonymous though — EdgeBits is made by nerdAppLabs, a software company since 2012, and the engineers who build it are named on their team page.
The founding team has 7+ years building industrial-edge platforms, deployed across factory floors processing sensor data from production equipment worldwide. That work built deep familiarity with OT protocols, brownfield environments, and what ERP systems actually need from the shop floor.
Open-source industrial IoTMQTT for the event bus. ISA-95 for the topic hierarchy. OPC-UA, Modbus, S7, Sparkplug B for the protocols. Standards plant IT teams already understand. No proprietary protocol. No vendor-only file format. No closed catalog.
ISA-95 · UNS MQTT · OPC-UA · Sparkplug BWe are in active conversation with auto parts, pharma, steel, textile, and FMCG manufacturers in North India. If your plant runs Siemens, ABB, Schneider Electric, or Allen-Bradley equipment and your data still lives in spreadsheets, that's exactly who we're talking to. References available on request during a demo.
Talk to us →Not a SCADA replacement, and not a historian replacement. It reads alongside what you already run and takes the data where SCADA was never meant to go — your ERP, your reports, your auditor.
It reads quietly in the background, on the same cables and the same screens your shift supervisor has used for ten years. Production counts reach your ERP on their own. Nothing on the floor changes, so there is no retraining and no window where output is at risk.
Replacing a SCADA platform with a certified integrator runs ₹15–20 lakh in India before a single dashboard is live. This starts on one line, and you own the licence rather than renting per tag. Connect a meter on Friday, show a dashboard on Monday.
A SCADA gateway usually wants an inbound firewall rule. This calls out from the plant and never in, so there is no inbound port to argue about and no three-month security review before you see data. The full architecture, for that team.
A sovereign deployment: perpetual licence, not a monthly rental. Your nodes, your server, your data. No per-tag fees, no data-volume charges.
Buy your edge nodes outright and run them on your own hardware. You own the software, not a subscription that stops when you do.
Built-in cross-site OEE dashboards, energy monitoring, predictive maintenance, and ERP-enriched reports. Also connects to Grafana, Power BI, or any BI tool via REST. Available as an add-on with any deployment.
Perpetual licence + optional AMC, tailored to your fleet. Talk to us for a quote, or model your own numbers first — the calculator shows its working and cites every multiplier.
Real questions from plant managers and IT heads, answered without the jargon.
It runs inside your plant network. No cloud dependency for core operation: reading machines, processing, alerts, and local storage all work without internet. If you want to push data to Azure IoT Hub, AWS IoT Core, SAP, or a BI tool, you configure that as optional outbound egress. Nothing phones home unless you tell it to.
Nothing gets replaced. EdgeBits connects to your existing equipment in read-only mode using the protocols it already speaks: Modbus, OPC-UA, S7. Your operators keep using the same SCADA screens. Your PLCs keep running the same programs. EdgeBits adds a data layer on top without touching the control layer.
The only thing you need is a Linux box to run the Edge Node software. If there is already a Linux server or industrial PC in your OT network, use that. If not, a Raspberry Pi 4 (~₹5,000) or a small industrial PC is all it takes.
No inbound ports. EdgeBits polls outbound from the plant to your cloud or central manager, the same direction as email or Windows Update. Plant IT teams routinely block inbound connections into OT networks. EdgeBits is designed around that constraint: nothing calls into the plant, everything calls out.
Ingest from shop floor: Modbus TCP/RTU, OPC-UA, Siemens S7, EtherNet/IP, MQTT, REST/HTTP, IEC 60870-5-104. Energy meters, PLCs, SCADA, IoT sensors. If it has a network port, there is a connector for it.
Push to enterprise/cloud: SAP RFC & OData, Sparkplug B, AVEVA PI, REST, MQTT, Grafana, Power BI via REST egress. New connectors are building blocks. The catalog grows without platform changes.
Three practical differences:
Your OT (operational technology) is your control layer: PLCs, SCADA, energy meters, sensors. Your IT is your business layer: SAP, Power BI, ERP, cloud. Right now they do not talk. Production data enters SAP manually, hours after the shift ends. Energy usage shows up on the monthly bill, not today's dashboard.
EdgeBits bridges that gap automatically. It reads from your control systems and delivers structured data to your business systems in real time. No manual entry, no data delays, no separate teams maintaining separate systems.
The short version: your PLCs speak to EdgeBits, EdgeBits speaks to your ERP. Nothing else changes.
No. EdgeBits is designed to be deployed by your in-house IT or OT team. Install the Edge Node on a Linux box, connect to one Modbus meter, build a pipeline in the browser-based editor. First dashboard in an afternoon; a full line in about a week. No certified partner required, no weeks of configuration, no large SI engagement before you see data.
Edge Manager is how you run the fleet (what is deployed where, by whom, and which sites are healthy). Your IT/OT team uses it to register nodes, manage ISA-95 topology, deploy pipelines to 50 sites at once, and monitor fleet health. It does not produce business insights.
Edge Analytics is where the numbers live (every reading lands here and becomes a report). Your plant manager and operations head use it for OEE per line, tag explorer across all sites, data quality monitor, and reports. Edge Nodes push data outbound via REST egress into Analytics' own time-series database. No inbound access to the plant required.
ERP correlation: Edge Analytics cross-references your machine data with ERP production orders, cost centers, and quality specs (SAP, Oracle, Tally). Cost per unit, yield vs plan, energy per batch, all in one place instead of assembled manually in Excel.
Do you need a historian? For most manufacturers, no. Edge Analytics stores raw data for 90 days, 15-minute aggregates for a year, and hourly aggregates for 3 years. AVEVA PI and FactoryTalk Historian are the right choice for highly regulated environments (pharma, nuclear) that require long raw-data retention and audit trails. For OEE, energy, and operational reporting, Edge Analytics covers it at a fraction of the cost.
The short version: Edge Manager runs the platform. Edge Analytics tells your business what the machines are doing.
No. EdgeBits is not a SCADA and not a historian replacement. It sits alongside your existing systems (Wonderware, iFIX, Ignition, AVEVA PI) and adds the pipeline layer that moves data to ERP, BI tools, and cloud. Your operators keep using the screens they know. Your control layer stays untouched.
Tell us what you're trying to connect and we'll set up a call. No pitch deck, no pressure, just a conversation about your factory and whether EdgeBits fits.
Or reach us directly at
hello@edgebits.io